Exposure#
Exposure refers to the presence of people, assets, or critical infrastructure (CI) systems in areas that are susceptible to natural hazards, such as floods, earthquakes, storms, or other disasters. When CI systems are exposed to these hazards, their functionality can be compromised, leading to cascading effects across dependent sectors. For example, damage to energy infrastructure during a storm can disrupt health services, transportation, and communication networks.
In risk assessments, exposure is a key component as it quantifies the physical presence of infrastructure within hazard-prone areas. Without understanding which infrastructure systems are exposed and where, it is impossible to accurately assess potential risks. This is where geospatial data, such as that provided by OpenStreetMap (OSM), becomes essential for mapping exposure and conducting vulnerability assessments.
Central to our assessment is the integration of open data collected and provided by OpenStreetMap. The goal of this platform is to create and distribute free and openly accessible geospatial and attributional information on the world’s features. With 4.5 million map changes/day, the OSM database counts approximately 15.5 billion georeferenced features as of 26th November 2020. The integration and pre-processing of OSM data provide a detailed, high-resolution understanding of infrastructure exposure on a global scale. The use of OSM allows for a standardized approach to assessing the vulnerability of CI systems by identifying key assets and their proximity to known hazard zones.
Geographical features in OSM are projected in the form of nodes, ways, and relations. A node represents a specific point in space and is defined by its latitude and longitude (e.g., telecommunication tower). The datatype “ways” exists as a line segment that is connected by two or more nodes (e.g., road). A polygon (or area) is described as a closed way, created when the last node of a series of line segments is connected to the beginning (e.g., hospital). Another datatype, “relations”, is an ordered list of features that groups nodes, ways, and relations into a larger unit. An example of unprocessed OSM data, including a breakdown of the basic datatypes, is shown in Figure 2. Each georeferenced element in OSM has an ID number that uniquely identifies it, along with details such as the user who modified the element and the time of last modification. Elements can be further specified by a list of attribute tags in the form of key-value pairs, whereby the value provides more detail to the key identifier. For example, primary roads that often link larger towns are specified under the key ‘highway’ in combination with the value ‘primary’.
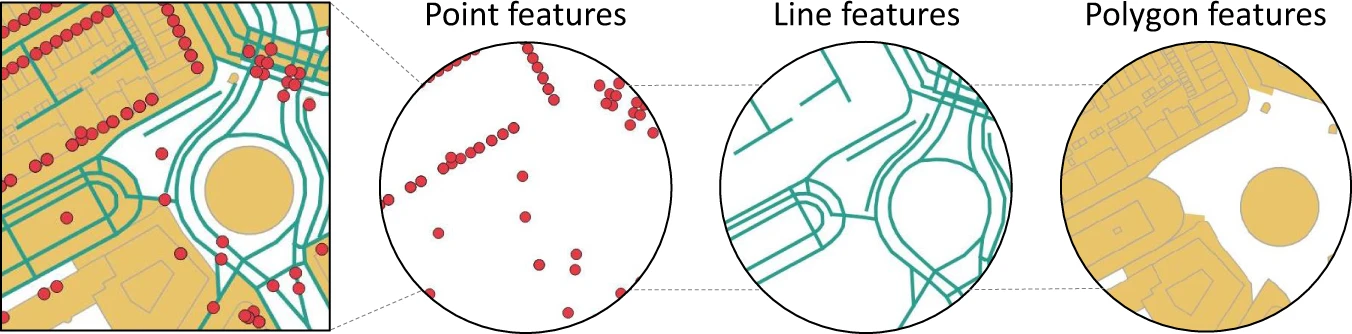 Figure 1: Visualization of raw OpenStreetMap data of a given area, with a breakdown by the datatypes (Nirandjan et al., 2022).